We started the day by doing the Alternating Currents and Voltages lab. In this lab we used the RLC Circuit Board. For the first part, we set up an AC circuit with the 100ohms resistor on the RLC board, voltmeter and ampmeter, connected to the function generator and logger pro. We zero both meters, and graphed voltage vs time and current vs time.
In AC circuit the voltage and current vary sinusoidally with time.
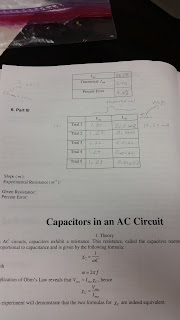
Here are our results. The experiment was done 5 times. We calculated Vmax by looking at statistics of the graph. For Vrms we use Vrms = Vmax/root(2). For theoretical Vrms we used the same formula, but the Vmax was the voltage from the function generator. Then for the percent error, we used
Percent error = (theoretical- experimental)(100)/(theoretical). We perform the same steps to find Imax, Irms, and percent error. Irms = Imax/root(2).
Here, we draw voltage and current vs time in the same plane, and something important to notice is that both sinusoidal graphs have different amplitude, the amplitude of I(t) is bigger by a factor of ωC.
In this photo we found Irms with given capacitor, frequency and Vrms. We said that Irms = Vrms /XC, where XC is the effective ohmic resistance of the capacitor or also known as capacitive reactance, and XC = 1/ωC, and ω = 2pi*f. We plug everything in and found that Irms = 0.06A.
We repeated the experiment one more time, and instead of using capacitor we connected the circuit to an inductor. An inductor creates a resistance within an AC source referred as XL which equals ωL, this formula was used to calculate the theoretical value. For the experimental value we used
XL = Vrms.exp / Irms.exp ,and our percent error turn out to be 7.9%.


No comments:
Post a Comment